Reliability Tests
We present the testing results to show VeriFinger 2025.2 template matching algorithm reliability on the data from the NIST Special Database 302. The testing was performed on a subset of the NIST database:
- 27040 fingerprint images with various image sizes were used for testing;
- 200 subjects were represented in the testing dataset, with capture sessions count ranging from 7 to 16 per sibject;
- 2000 unique fingers were in the testing dataset.
Two tests were performed during each experiment:
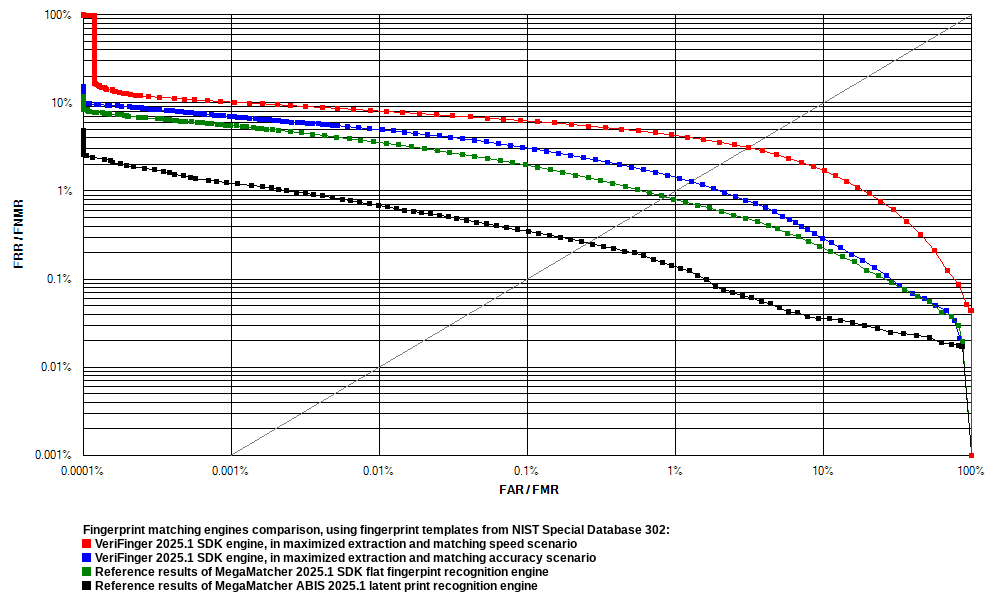
- Test 1 maximized extraction and matching speed. VeriFinger 2025.2 engine reliability in this test is shown as the red curve on the ROC chart.
- Test 2 maximized extraction and matching accuracy. VeriFinger 2025.2 engine reliability in this test is shown as the blue curve on the ROC chart.
In addition, biometric engines from the higher tier products were also tested using the same fingerprint datasets to provide reference results:
- Test 3 shows the reliability of the MegaMatcher 2025.2 SDK flat fingerprint recognition engine. The reliability of the engine in this test is shown as the green curve on the ROC chart. MegaMatcher is designed for large-scale AFIS and multi-biometric systems, which operate with larger biometric databses and require higher level of matching accuracy. VeriFinger 2025.2 SDK customers can contact us for more details about upgrading to MegaMatcher 2025.2 SDK.
- Test 4 shows the reliability of the latent print recognition engine, which is available in the MegaMatcher Criminal Investigation. The reliability of the engine in this test is shown as the black curve on the ROC chart. MegaMatcher Criminal Investigation employs an algorithm that prioritizes accuracy in latent print matching and takes into consideration automatically detected latent print feature points as well as the examiner's input. Contact us for more details about the MegaMatcher Criminal Investigation.