Reliability Tests
The Voice Verification system template matching algorithm has been tested with voice samples taken from the XM2VTS Database, as well as with voice samples from Neurotechnology's internal dataset. Two datasets included fixed phrases pronounced by all subjects within a particular dataset, and one dataset included unique phrases for each subject.
Gallery and probe were populated in this way:
- Gallery – each voice sample from each source dataset was truncated to 9 seconds by removing excessive part at the end.
-
Probe – each voice sample from each source dataset was processed in this way:
- Each voice sample was truncated to 9 seconds by removing excessive part at the end and added to the probe
- The truncated 9-second samples were cut into three 3-second samples, thus adding three additional samples out of each original sample to the probe.
- The truncated 9-second samples were truncated again to 6 seconds by removing excessive part at the end and added to the probe.
- The truncated 9-second samples were truncated again to 6 seconds by removing excessive part at the beginning and added to the probe.
| Voiceprint datasets used for Voice Verification system engine testing | |||
|---|---|---|---|
| Experiment 1 | Experiment 2 | Experiment 3 | |
| Source data | XM2VTS (phrase 1) |
Neurotechnology internal dataset 1 | Neurotechnology internal dataset 2 |
| Fixed/unique phrase | Fixed | Fixed | Unique |
| Subjects in the dataset | 295 | 42 | 42 |
| Recording sessions per subject | 8 | 1 - 10 | 1 - 10 |
| Total gallery size (voice samples) | 2,360 | 305 | 309 |
| Total probe size (voice samples) | 14,160 | 1,830 | 1,854 |
| Total number of template comparisons | 16,687,566 | 261,960 | 269,100 |
Two tests were performed during each experiment:
- Test 1 used compact template extraction model, designed for Android platform. The reliability of matching the extracted templates is shown as red curves on the ROC charts.
- Test 2 used large template extraction model, designed for Server platform. The reliability of matching the extracted templates is shown as blue curves on the ROC charts.
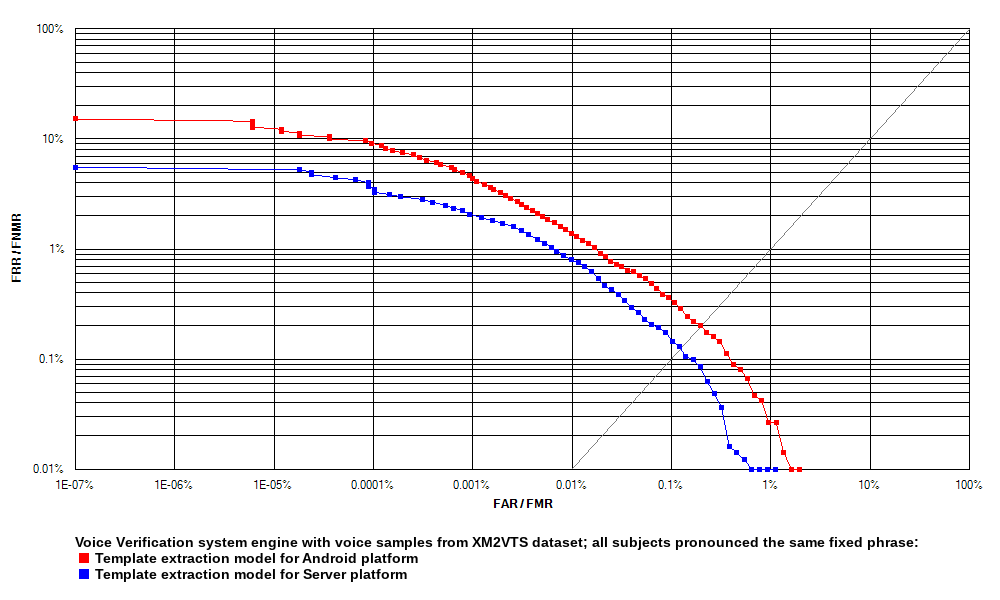
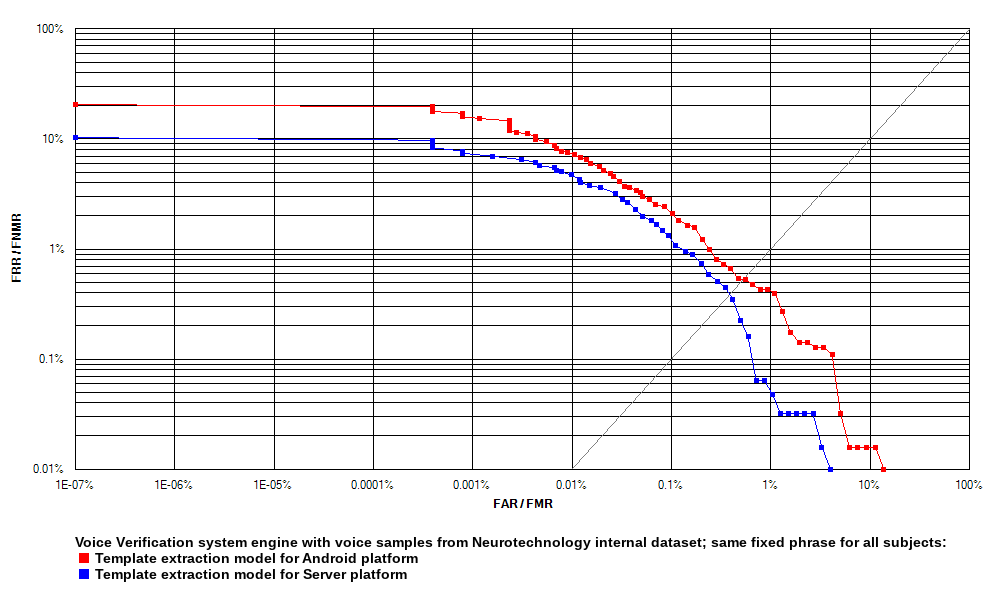
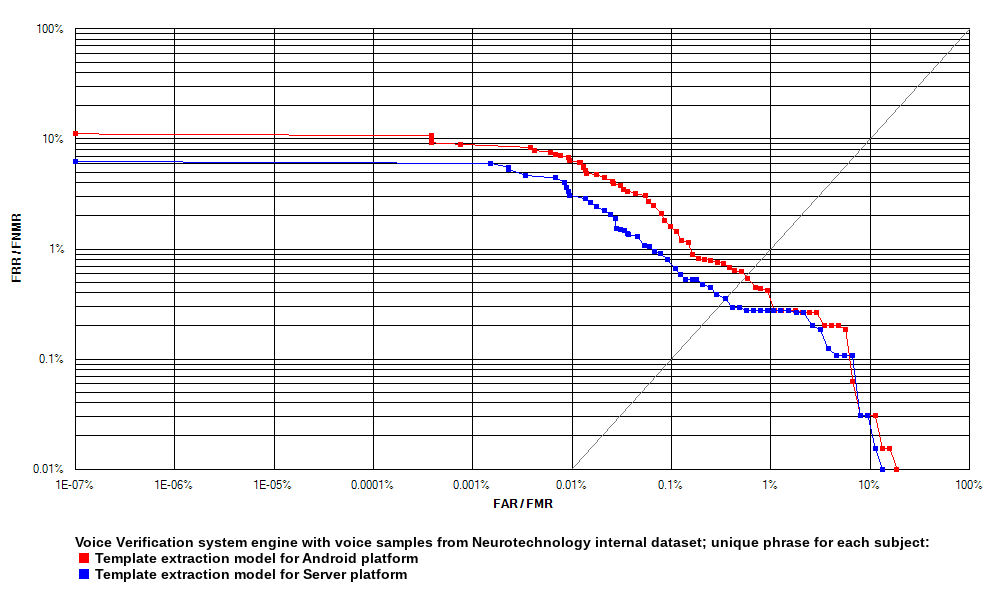
Receiver operation characteristic (ROC) curves are usually used to demonstrate the recognition quality of an algorithm. ROC curves show the dependence of false rejection rate (FRR) on the false acceptance rate (FAR). Charts with ROC curves for each of the experiments are available above.
| Voice Verification 2025.2 engine reliability tests | ||||||
|---|---|---|---|---|---|---|
| Exp. 1 | Exp. 2 | Exp. 3 | ||||
| Test 1 | Test 2 | Test 1 | Test 2 | Test 1 | Test 2 | |
| EER | 0.1982 % | 0.1246 % | 0.5041 % | 0.3971 % | 0.5643 % | 0.3516 % |
| FRR at 1 % FAR | 0.0263 % | 0.0040 % | 0.4282 % | 0.0634 % | 0.4174 % | 0.2783 % |
| FRR at 0.1 % FAR | 0.3595 % | 0.1757 % | 2.4100 % | 1.3160 % | 1.5920 % | 0.8040 % |
| FRR at 0.01 % FAR | 1.3890 % | 0.8037 % | 7.4850 % | 4.7100 % | 6.3080 % | 3.0770 % |