Reliability Tests
We present the testing results to show the template verification and iris liveness check reliability evaluations for the VeriEye 13.1 algorithm.
Template Verification
Data from several iris scanners was used for testing VeriEye 13.1 template verification algorithm reliability.
| Iris image datasets used for VeriEye 13.1 algorithm testing | |||||
|---|---|---|---|---|---|
| Experiment 1 | Experiment 2 | Experiment 3 | |||
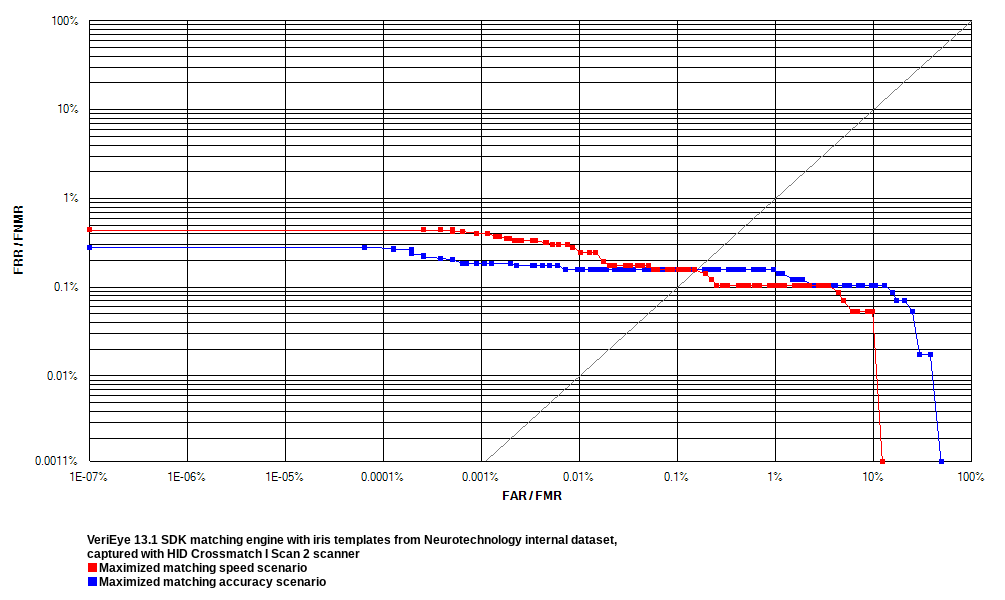
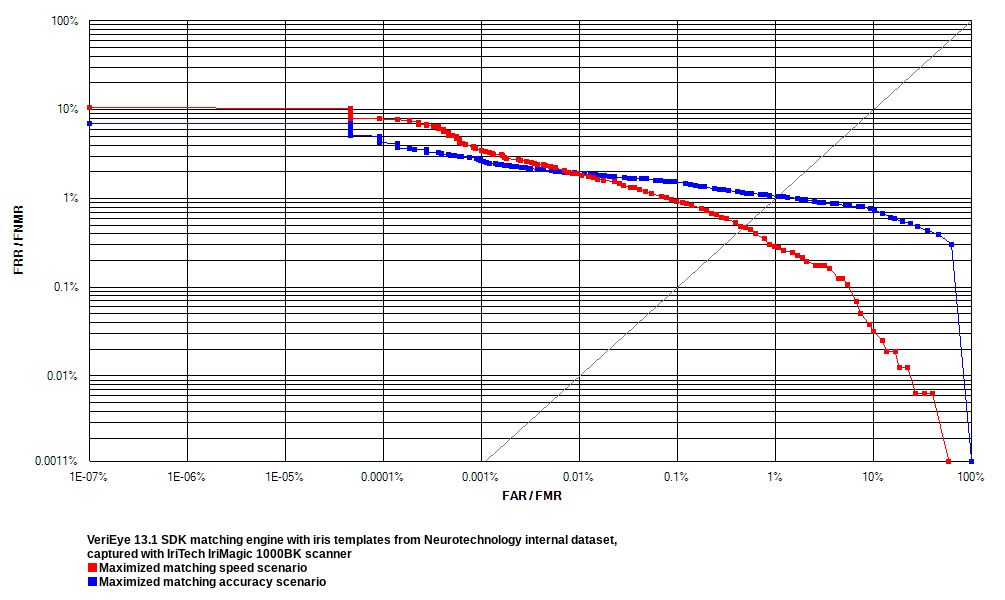
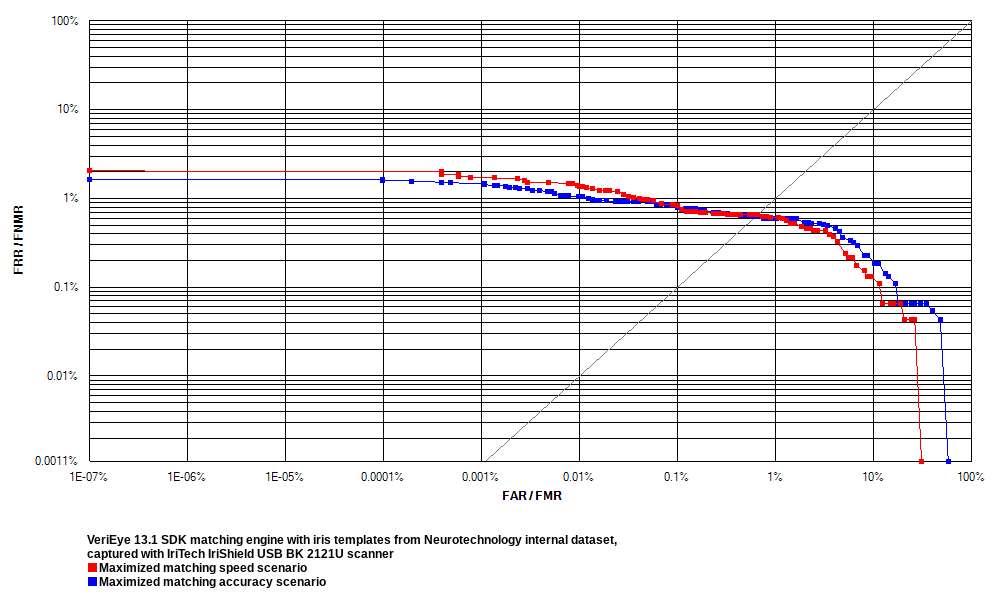
| Iris scanner model | HID Crossmatch I Scan 2 | IriTech IriMagic 1000 BK | IriTech IriShield USB BK 2121U | ||
| Image count | 1260 | 2100 | 1020 | ||
| Subject count | 63 | 105 | 51 | ||
| Unique iris count | 126 | 210 | 102 | ||
| Session count | 10 | 10 | 10 | ||
| Image size (pixels) | 640 x 480 | 640 x 480 | 640 x 480 | ||
Two tests were performed during each experiment:
- Test 1 maximized matching accuracy. VeriEye 13.1 algorithm reliability in this test is shown as blue curves on the ROC charts.
- Test 2 maximized matching speed. VeriEye 13.1 algorithm reliability in this test is shown as red curves on the ROC charts.
Receiver operation characteristic (ROC) curves are usually used to demonstrate the recognition quality of an algorithm. ROC curves show the dependence of false rejection rate (FRR) on the false acceptance rate (FAR).
Click to zoom
Click to zoom
Click to zoom
| VeriEye 13.1 algorithm reliability tests | ||||||
|---|---|---|---|---|---|---|
| Experiment 1 | Experiment 2 | Experiment 3 | ||||
| Test 1 | Test 2 | Test 1 | Test 2 | Test 1 | Test 2 | |
| EER | 0.1509 % | 0.1528 % | 0.9763 % | 0.4630 % | 0.5987 % | 0.6255 % |
| FRR at 0.1 % FAR | 0.1587 % | 0.1587 % | 1.5360 % | 0.9274 % | 0.7843 % | 0.8279 % |
| FRR at 0.01 % FAR | 0.1587 % | 0.2822 % | 1.9460 % | 1.8860 % | 1.0460 % | 1.3730 % |
| FRR at 0.001 % FAR | 0.1852 % | 0.4056 % | 2.6560 % | 3.6210 % | 1.5030 % | 1.7430 % |
Liveness Check
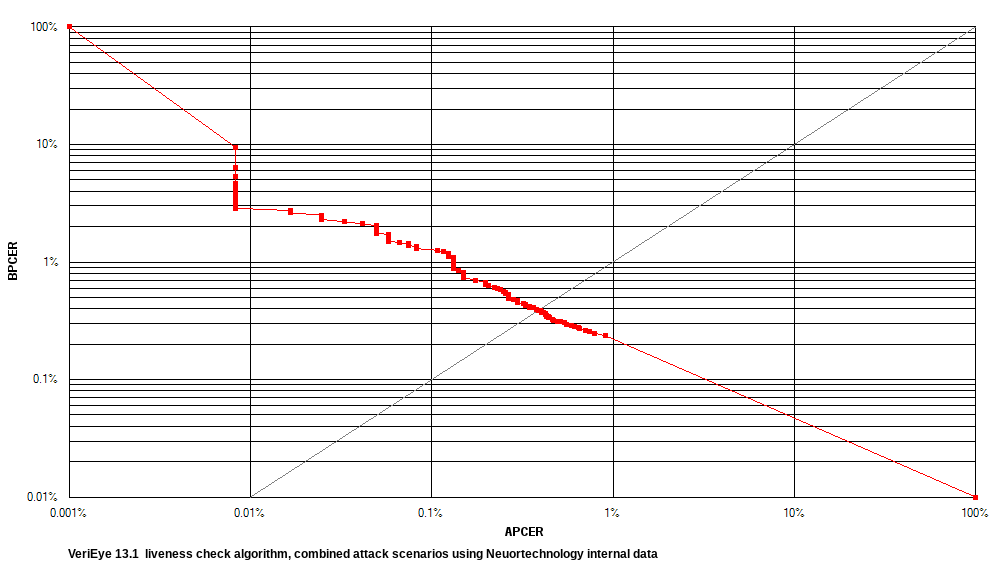
Neurotechnology's internally collected dataset was used for testing the iris liveness check algorithm. The dataset contained:
- 113,242 real samples.
- 12,098 attack samples for spoofing iris liveness check using printed photos on regular laser printer paper and photo paper.
Receiver operation characteristic (ROC) curves are usually used to demonstrate the accuracy of a biometric algorithm. A ROC curve shows the dependence of Bona fide Presentation Classification Error Rate (BPCER) on the Attack Presentation Classification Error Rate (APCER). Equal error rate (EER) is the rate at which both APCER and BPCER are equal.
| VeriEye 13.1 liveness check algorithm testing results with Neurotechnology internal dataset | |
|---|---|
| EER | 0.387 % |
| BPCER at 10 % APCER | 0.236 % |
| BPCER at 1 % APCER | 0.236 % |
| BPCER at 0.1 % APCER | 1.297 % |
| BPCER at 0.01 % APCER | 2.863 % |