Reliability Tests
We present the testing results to show the template verification reliability evaluations for the Face Verification system. The face liveness check algorithm was tested by iBeta and certified as compliant with ISO 30107-3 Biometric Presentation Attack Detection Standards.
University of Massachusetts Labeled Faces in the Wild (LFW) public dataset was used for testing the template verification reliability of Neurotechnology Face Verification system. The following modifications were applied to the dataset:
- According to the original protocol, only 6,000 pairs (3,000 genuine and 3,000 impostor) should be used to report the results. But recent algorithms are "very close to the maximum achievable by a perfect classifier" [source]. Instead, as Neurotechnology algorithms were not trained on any image from this dataset, verification results on matching each pair of all 13,233 face images of 5,729 persons were chosen to be reported.
- All identity mistakes, which had been mentioned on the LFW website, were fixed. Also, several not mentioned issues were fixed.
- Some images from the LFW dataset contained multiple faces. The correct faces for assigned identities were chosen manually to solve these ambiguities.
Three experiments were performed with each dataset:
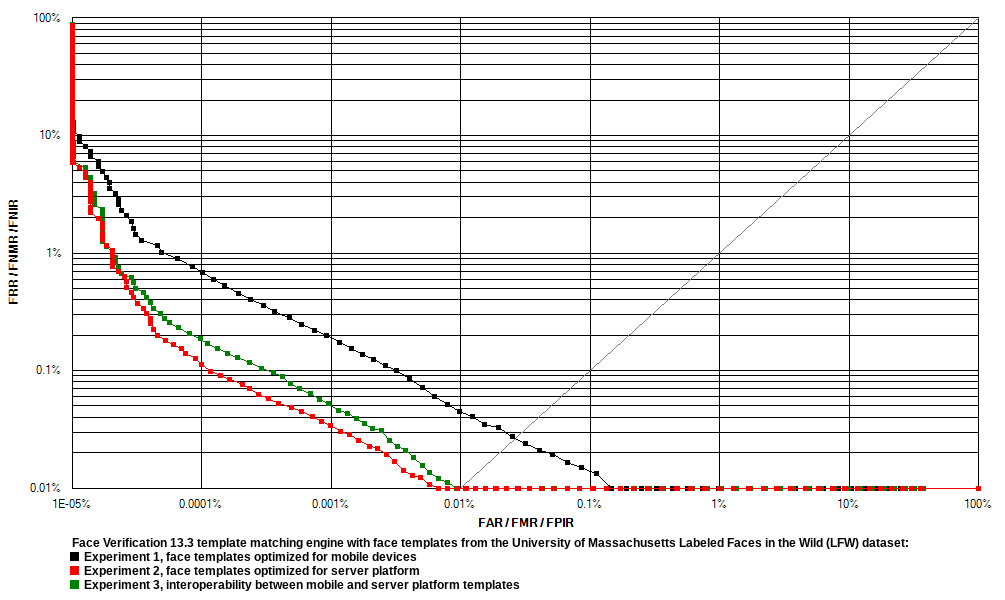
- Experiment 1 used face templates which were extracted with settings for mobile device usage optimization. The Face Verification 13.3 algorithm reliability in this experiment is shown on the ROC chart as black curve.
- Experiment 2 used face templates which were extracted with settings for server platform usage optimization. The Face Verification 13.3 algorithm reliability in this experiment is shown on the ROC chart as red curve.
- Experiment 3 used face templates from Experiments 1 and 2 to test interoperability between them. The Face Verification 13.3 algorithm reliability in this experiment is shown on the ROC chart as green curve.
Receiver operation characteristic (ROC) curves are usually used to demonstrate the recognition quality of an algorithm. ROC curves show the dependence of false rejection rate (FRR) on the false acceptance rate (FAR). Equal error rate (EER) is the rate at which both FAR and FRR are equal.
| Face Verification 13.3 template verification algorithm reliability testing results with face images from LFW dataset | |||
|---|---|---|---|
| Experiment 1 | Experiment 2 | Experiment 3 | |
| FRR at 0.1 % FAR | 0.0149 % | 0.0029 % | 0.0025 % |
| FRR at 0.01 % FAR | 0.0446 % | 0.0078 % | 0.0099 % |
| FRR at 0.001 % FAR | 0.1985 % | 0.0339 % | 0.0520 % |